some pages are slow
Hello !Friendica Support ..
I don't know what page load times others have, just experience slow responses on my instance. A nice time woud be < 1 second, maybe.
I have some pages that are significantly slower:
- the statistics in admin (loong time, didn't measure)
- network page: 13s
- my profile page: 39s
- friendica support page: 47s
- admin page: 2s
so simetimes slower, sometimes a bit faster. but it currently frustrates me a bit. it is not a joy to use.
I am the only user on my instance and it is running on the "S" model here: https://php-friends.de/vserver-ssd
Schmaker
•That's definitely not normal (except for admin statistics, these are actually slow. I'm also single-user instance and I don't have issues like these.
Tried to check your instance and it takes hell of a time to load, there is something fishy going on on your server.Aren't you "bombarded" by activitypub trolls or something? (check your worker queue)
xy..
•Schmaker
•xy..
•but I have already opened an issue on github: https://github.com/friendica/friendica/issues/12777
xy..
•slow: 225.0. I don't know what exactly it means but its a high number (?) slow queries somehowxy..
•maybe someone knows what that is
xy..
•xy..
•Schmaker
•xy..
•Michael 🇺🇦
•Activate the
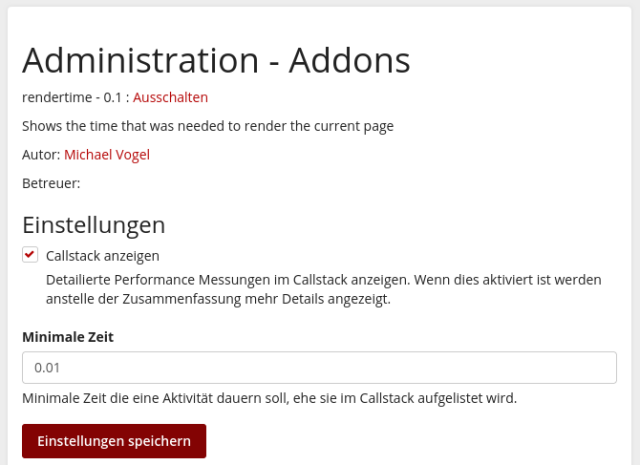
rendertimeaddon:Then you will see data like this:
xy..
•Can you please have a look? below this comment
xy..
•Thanks! This is an example from this page: https://boerdica.de/profile/noidea
It seems one query takes longer..
Post::select (216), Conversations::content (93), Index::content (250), BaseModule::run (711): 14.44Do you have an idea what to do next?
... show moreDatenbank: 21.32/0, Netzwerk: 0, Darstellung: 0.2, Sitzung: 0, I/O: 0.01, Sonstiges: 0.32, Gesamt: 21.85
Class-Init: 0.076, Boot: 0.022, Init: 0, Inhalt: 21.746, Sonstiges: 0.005, Gesamt: 21.849
Thanks! This is an example from this page: https://boerdica.de/profile/noidea
It seems one query takes longer..
Post::select (216), Conversations::content (93), Index::content (250), BaseModule::run (711): 14.44Do you have an idea what to do next?
Datenbank: 21.32/0, Netzwerk: 0, Darstellung: 0.2, Sitzung: 0, I/O: 0.01, Sonstiges: 0.32, Gesamt: 21.85
Class-Init: 0.076, Boot: 0.022, Init: 0, Inhalt: 21.746, Sonstiges: 0.005, Gesamt: 21.849
Michael 🇺🇦
•You will have to have a look at your database server configuration. Possibly you can assign more memory to the database server. Please have got a look at some guides out there in the internet concerning database performance improvements.
xy..
•xy..
•@Michael Vogel .. so, I have done this. it seems these queries appear quite often in the db-log file:
... show more@Michael Vogel .. so, I have done this. it seems these queries appear quite often in the db-log file:
seems to be
FROM gserverin each queryMichael 🇺🇦
•utopiArte
•#bookmark